|
Magnetoencephalography (MEG) is a noninvasive technique by which the activity or the cortical neurons can be measured with very good temporal resolution and moderate spatial resolution. When using a MEG record, as a research or clinical tool, the investigator may face a problem of extracting the essential features of the neuromagnetic signals in the presence of artifacts. The amplitude of the disturbances may be higher than that of the brain signals, and the artifacts may resemble pathological signals in shape.
In [41], the authors introduced a new method to separate brain activity from artifacts using ICA. The approach is based on the assumption that the brain activity and the artifacts, e.g. eye movements or blinks, or sensor malfunctions, are anatomically and physiologically separate processes, and this separation is reflected in the statistical independence between the magnetic signals generated by those processes. The approach follows the earlier experiments with EEG signals, reported in [40]. A related approach is that of [33].
The MEG signals were recorded in a magnetically shielded room with a 122-channel whole-scalp Neuromag-122 neuromagnetometer. This device collects data at 61 locations over the scalp, using orthogonal double-loop pick-up coils that couple strongly to a local source just underneath. The test person was asked to blink and make horizontal saccades, in order to produce typical ocular (eye) artifacts. Moreover, to produce myographic (muscle) artifacts, the subject was asked to bite his teeth for as long as 20 seconds. Yet another artifact was created by placing a digital watch one meter away from the helmet into the shielded room.
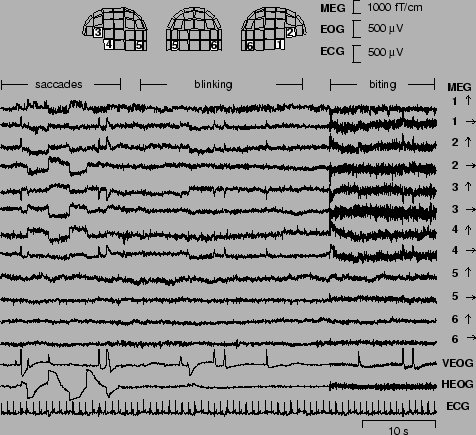
Figure 11 presents a subset of 12 spontaneous MEG signals xi(t) from the frontal, temporal, and occipital areas [41]. The figure also shows the positions of the corresponding sensors on the helmet. Due to the dimension of the data (122 magnetic signals were recorded), it is impractical to plot all the MEG signals xi(t), i = 1,..., 122. Also two electro-oculogram channels and the electrocardiogram are presented, but they were not used in computing the ICA.

|
The signal vector ![]() in the ICA model (4) consists now of the
amplitudes xi(t) of the 122 signals at a certain time point, so the
dimensionality is n = 122. In the theoretical model,
in the ICA model (4) consists now of the
amplitudes xi(t) of the 122 signals at a certain time point, so the
dimensionality is n = 122. In the theoretical model, ![]() is
regarded as a random vector, and the measurements
is
regarded as a random vector, and the measurements
![]() give a set of
realizations of
give a set of
realizations of ![]() as time proceeds. Note that in the basic ICA
model that we are using, the temporal correlations in the signals are
not utilized at all.
as time proceeds. Note that in the basic ICA
model that we are using, the temporal correlations in the signals are
not utilized at all.
The
![]() vectors were whitened using PCA and the dimensionality was
decreased at the same time. Then, using the FastICA algorithm, a
subset of the rows of the separating matrix
vectors were whitened using PCA and the dimensionality was
decreased at the same time. Then, using the FastICA algorithm, a
subset of the rows of the separating matrix ![]() of eq. (6)
were computed. Once a vector
of eq. (6)
were computed. Once a vector ![]() has become available, an ICA
signal si(t) can be computed from
has become available, an ICA
signal si(t) can be computed from
![]() with
with
![]() now denoting the whitened and lower dimensional signal
vector.
now denoting the whitened and lower dimensional signal
vector.
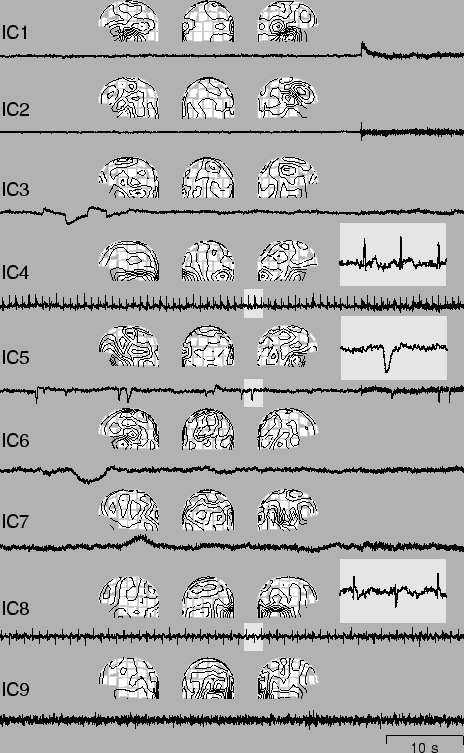
Figure 12 shows sections of 9 independent components (IC's) si(t), i = 1, ..., 9 found from the recorded data together with the corresponding field patterns [41]. The first two IC's are clearly due to the musclular activity originated from the biting. Their separation into two components seems to correspond, on the basis of the field patterns, to two different sets of muscles that were activated during the process. IC3 and IC5 are showing the horizontal eye movements and the eye blinks, respectively. IC4 represents the cardiac artifact that is very clearly extracted.

|
To find the remaining artifacts, the data were high-pass filtered, with cutoff frequency at 1 Hz. Next, the independent component IC8 was found. It shows clearly the artifact originated at the digital watch, located to the right side of the magnetometer. The last independent component IC9 is related to a sensor presenting higher RMS (root mean squared) noise than the others.
The results of Fig. 12 clearly show that using the ICA technique and the FastICA algorithm, it is possible to isolate both eye movement and eye blinking artifacts, as well as cardiac, myographic, and other artifacts from MEG signals. The FastICA algorithm is an especially suitable tool, because artifact removal is an interactive technique and the investigator may freely choose how many of the IC's he or she wants.
In addition to reducing artifacts, ICA can be used to decompose evoked fields [42], which enables direct access to the underlying brain functioning, which is likely to be of great significance in neuroscientific research.